In a significant stride towards inclusive technology, researchers have developed ChartA11y, an innovative app designed to make visual data accessible to blind smartphone users. This groundbreaking tool transforms two-dimensional visualizations into a tactile and auditory experience, enabling users to interact with and understand complex data representations.
ChartA11y was created through a participatory and iterative design process, involving 13 collaborative sessions with two blind partners. This approach ensured that the app’s features and functionalities were tailored to the specific needs and preferences of its intended users. The researchers aimed to go beyond simple auditory feedback, incorporating multimodal interactions and multisensory data representations to provide a comprehensive understanding of visual information.
The app employs a two-mode setting to facilitate direct chart access and understanding. The first mode, a semantic navigation framework, guides users through the data using auditory cues and tactile feedback. The second mode, direct touch mapping, allows users to explore the chart by touching the screen, with the app providing real-time feedback about the data points under their fingers. This dual-mode approach ensures that users can interact with the data in a way that suits their individual preferences and comfort levels.
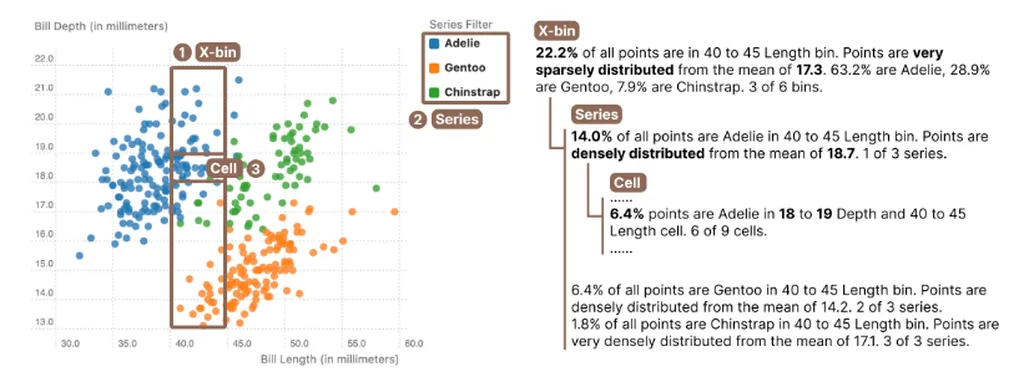
One of the key challenges addressed by ChartA11y is the accessibility of scatter plots, which present unique difficulties due to their non-linear data distribution. By re-designing traditional touch-to-audio interactions, the app offers a novel solution that enables blind users to interpret and understand these complex visualizations. This advancement not only expands the range of accessible data representations but also opens up new possibilities for blind individuals to engage with data-driven content.
The practical applications of ChartA11y extend beyond personal use, offering potential benefits for education, professional development, and data analysis. For instance, students with visual impairments can now access and interact with graphical data in educational materials, while professionals can utilize the app to analyze and interpret data in their respective fields. Moreover, the app’s innovative approach to accessible data visualization could inspire future developments in assistive technologies, paving the way for a more inclusive digital landscape.
In summary, ChartA11y represents a significant breakthrough in the field of accessible technology, providing blind smartphone users with a powerful tool to interact with and understand visual data. Through its participatory design process and innovative multimodal interactions, the app offers a novel approach to data accessibility that has the potential to transform the way blind individuals engage with the digital world. As technology continues to evolve, the principles and techniques demonstrated by ChartA11y may serve as a foundation for future advancements in assistive technologies, ultimately contributing to a more inclusive and accessible society. Read the original research paper here.